| Previous Chapter | Next Chapter |
|
|
|
The big question is this: When we need the power the most what is the output of wind? When we need it the most is when we are in peak demand.
In this 2006 report to the OPA, IESO, and CanWEA (Canadian Wind Energy Association), they defined peak demand as any hours that were within 10% of the biggest demand of the month. The wind output during those hours was called the Capacity Value in that report. On page 7 they stated:
The average capacity value of the wind resource in Ontario during the summer (peak load) months is approximately 17%. The capacity value ranges from 38% to 42% during the winter months (November to February) and from 16% to 19% during the summer months (June to August). Since 87% of the hits (periods within 10% of the load peak) occur during the summer months, the overall yearly capacity value is expected to be heavily weighted toward the summer. The overall yearly capacity value is approximately 20% for all wind penetration scenarios. In other words, 10,000 MW of installed nameplate wind capacity is equivalent to approximately 2,000 MW of firm generation capacity.
Many more wind projects have been built since 2006, so this chapter will recreate this analysis up to 2010.
There is a wide range of output from wind when the demand is highest for any given day. For example, Jan 1, 2010’s hourly demand and wind HCF output looked like this:
As one can see the output from the various wind farms was well into the high HCF, especially when demand was the highest during the evening hours. Looks quite satisfactory, doesn’t it. Well…
This is Jan 7 2010, 6 days later:
Demand was considerably higher that day from Jan 1, but the HCF from wind was virtually non-existent.
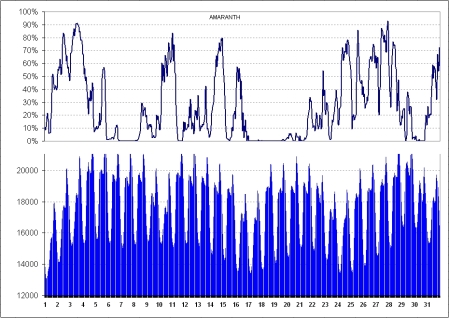
This graph shows the pulsating demand for every hour for all of Jan 2010, with the HCF for Amaranth over top on the same hourly scale (Click to enlarge):
The wind pulsating, as warm and cold fronts move through the area, are clear, and obviously do not match up with the demand cycle.
Scatter plotting the demand vs Amaranth’s HCF for January looks like this:

Each dot is an hour. As you can see there is no correlation between demand and output . 39% of the hours are well below 10% HCF, and many hours are zero (16% of the hours). And the winter is supposed to be good for wind!
The next chapters will look at each wind farm for the two high demand months, January and July to determine the Capacity Value. Using the demand records, each month’s maximum demand was obtained by getting the single highest hour of demand in that month – the Monthly Demand Maximum (MDM). To get the hours and days that are within 10% of that Monthly Demand Maximum, each hour of demand in the corresponding month had to be between MDM-(MDM*.1) and MDM. This gave a recordset of hours for all days within that 10% of demand, called Hours 10% Max Demand.
Then the Hourly Capacity Factor was matched up to those days and hours to see what the output was during those Hours of 10% Max Demand. See the next chapter for how this breaks out.
|
|
|
| Previous Chapter | Next Chapter |


[…] the wind doesn’t blow when we need it the most. This blog post details the difference between peak energy demand and wind capacity factor. Long story short, […]
Ontario is now rolling out 500MW of grid storage, with much more to follow. This blog is correct in that the weak point of wind is the mismatch between supply and demand. However the solution isn’t the abandonment of wind but the parallel adoption of grid storage to time-shift supply to match demand.
Unless you’d rather go back to coal…
Adding storage grossly inflates the costs of producing power, so you can count on your bills doubling to pay for the storage. Return on storage is less than 50%, that means for every joule of energy wind puts into storage, you get only 1/2 joule back. That makes wind even less efficient.
Coal? No. Liquid Fluoride Thorium Reactors. They will make wind and solar, and even uranium reactors, completely obsolete.
Going LFTR and your bills will fall big time. They can produce power for 2-5c compared to wind + storage at 30c.